
Streamlining the Cloud provisioning experience
Saved 1000+ work hours by improving the workflow of engineers and database admins.
Problem context
Engineers want database assets provisioned quickly for their applications. So, they submit requests either through chat, email, or JIRA tickets.
Admins could take anywhere between 1 day to 1 week to fulfill these requests using multiple disjointed systems while dealing with critical incidents on a daily basis.
The experience is broken for both the Engineer and the admin causing delays for the engineers and redundant work for the admins costing the company 1000+ work hours annually.

Role
End-to-End Product Design
Team
2 Designers
1 Product manager
10+ Developers
1 Data Analyst
Duration
1 year
Final Solution
A self-service database portal that is accessible to engineers and admins.
Outcome
Successfully reduced the time it took to provision and manage database assets. This helped both the Engineer and the Admin save time and be productive.
100%
Task success rate
2 mins
Average time on task
0
Support tickets
Defining use cases and envisioning future user journeys
Engineers need to _________________

How might we help our engineers and admins ?
We converged on a self-service database portal embedded within Cloudview ( Visa's cloud service ) that is accessible to engineers. Although this approach is focused on the engineer as the end user, this saves time for both personas.

After diving deep into the domain, pain points, and current workflows, we identified on 3 key ways to address the problem

Simplify domain complexity
Meet the engineer where they are and make the system work for them. Not the other way around.
Productize Admin's workflow
Turn the admin's service into a product, so that engineers can self serve.

Unify the provisioning stack
Centralize the solution to 1 portal rather than having to use multiple disjointed systems.
Frameworks to bring MVP to life step by step
Working with PMs to create user stories.

Identify the intersection of knowledge between admins and engineers.
Classify domain into 3 categories - Engineer's perspective, Admin's perspective and the intersection.

Identify use case dependencies and prioritize core flows.
Use cases layer on top of each other. This gives us a natural order to define user journeys as stories.

Separate request details from database asset details when defining IA.
One of the confusing aspects was scoping which sets of details can be technically integrated and shown on various dashboards.
Information architecture
Simplified version for brevity.

Iteration #1 - Does the content make sense to the user?


3 key major learnings from usability tests with engineers:
Engineers need more help understanding the field labels
There were too many fields that the engineers did not recognize.
System needs to do more to abstract details
Engineers thought some fields were redundant and irrelevent.
Need to present in a way that they dont feel overwhelmed
Engineers were overwhelmed seeing the volume of data expected from them
Iteration #2 - Meeting the user where they are in their journey
3 key ways I improved on the designs
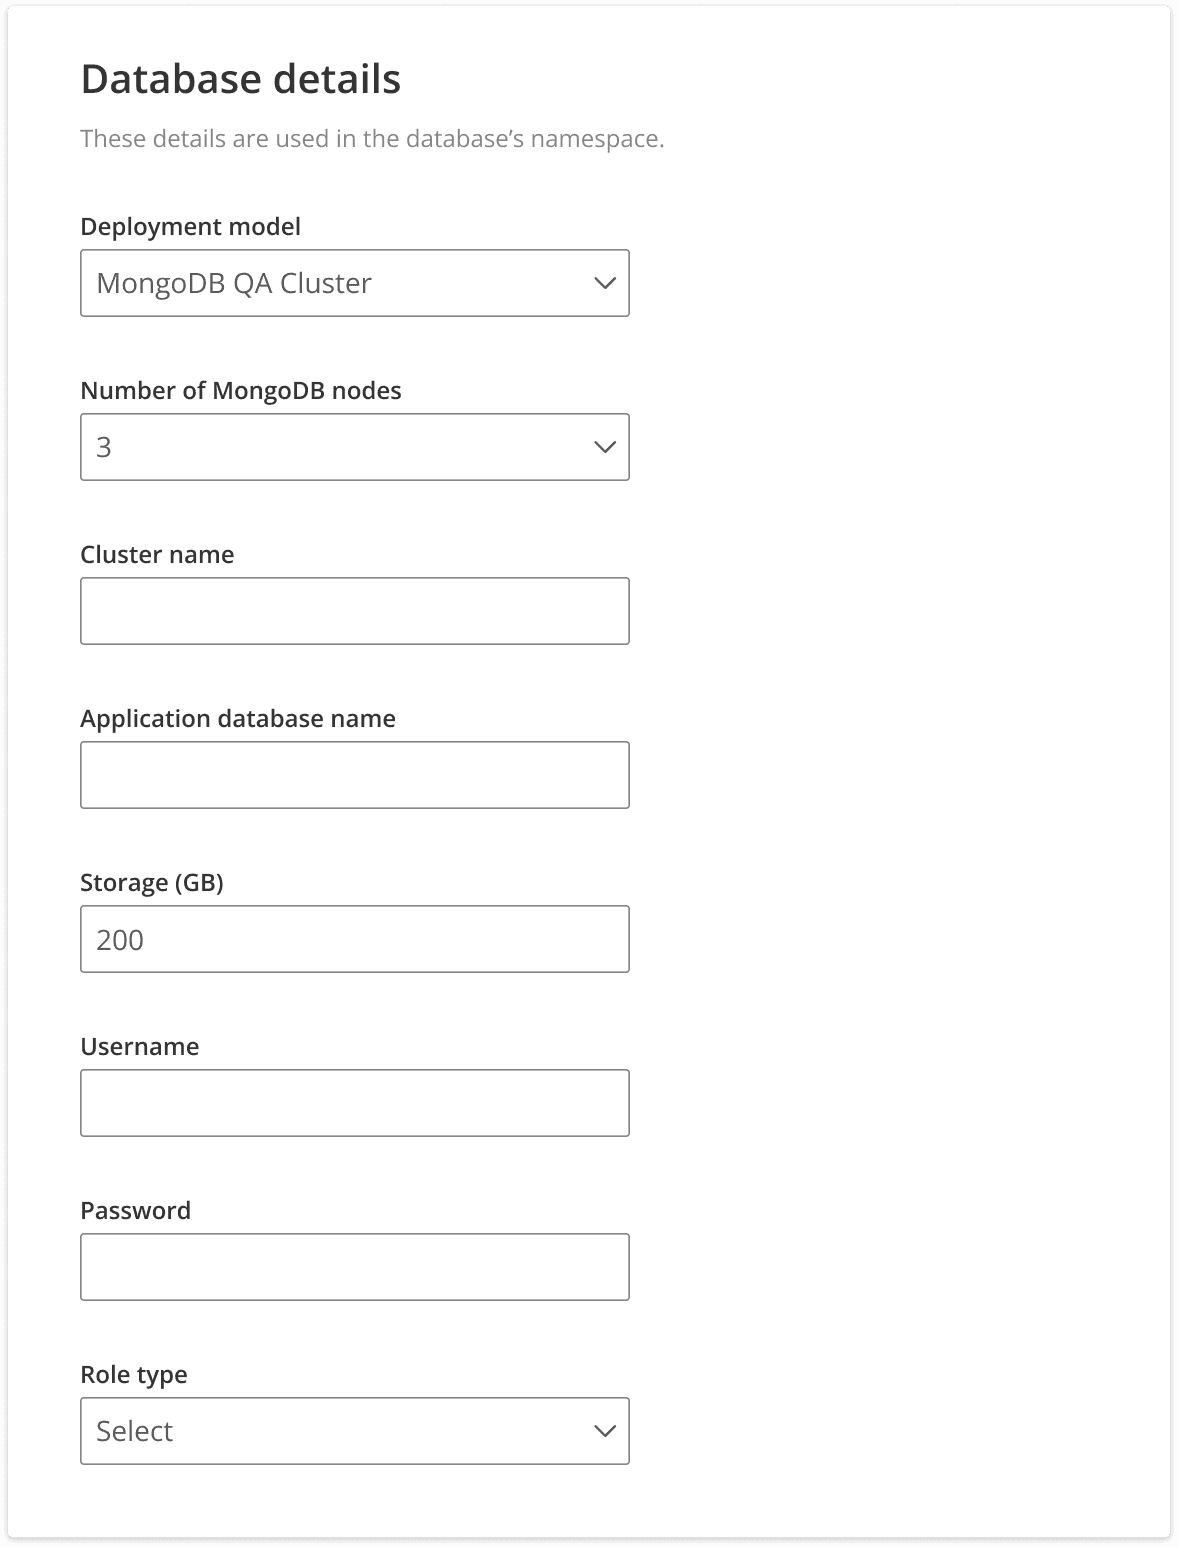
Data-driven defaults
What
Default values from historical data.
Standardizing database offerings from the operations team.
Why
Matches the user's mental model of the system.
Reduces number of form fields the user has to enter. This reduces cognitive load.
Result
Reduced the manual data entry significantly and engineers were able to complete the entire workflow unaided.


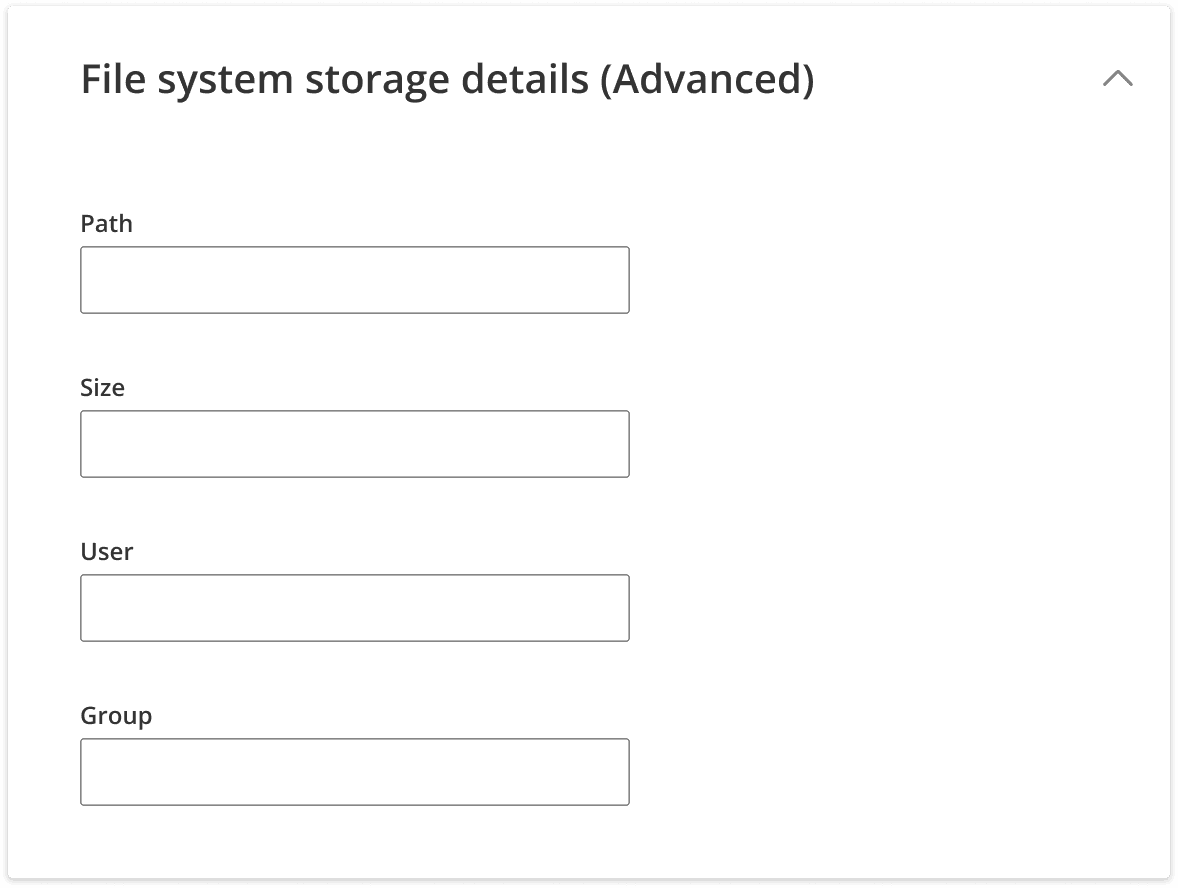
Logical data hierarchy
What
Mirrored the application technical stack and used logical groups and accordions to reveal advanced information strategically.
Why
User can focus on 1 logical group at a time. This reduces cognitive load.
Result:
I was able to solidify the Information architecture with a high degree of confidence. If any new data is introduced in the future, the IA was flexible enough to accommodate it.
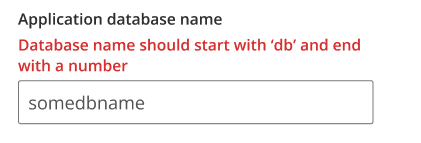
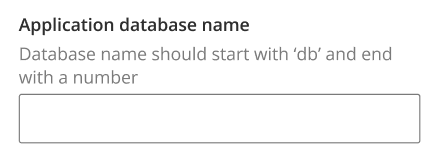
In-context help
What
Info icons, tooltips, inline instructions and error state to guide users throughout the journey
Why
Most users almost knew what to do, they just needed some validation. This helps them input data with confidence.
Result
Improved the task completion success rate.

Making it easy to request

Database portal entry point
Engineers found this to be very user friendly because it matches their mental model.
See all previous requests from team
Accessible as a primary navigation
Table format to quickly filter, scan and get to the right data point
Its an entry point to discover cloning older requests, speeding up future requests.


Accessing team's inventory
Accessible as a primary navigation
Data points displayed addresses the most frequently asked questions.
Its an entry point to discover cloning existing asset, speeding up future requests.
Expanding the scope into other dependent use cases
Visibility into the status of their request
Converged on visual explorations.
Testing indicated that users wanted to see who the approvers were and how long it would take.
Presented the entire approval flow at a glance so that users can reach out to approvers themselves if required to speed up process.


Access database credentials and connection details
Most important queries answered right on the dashboard.
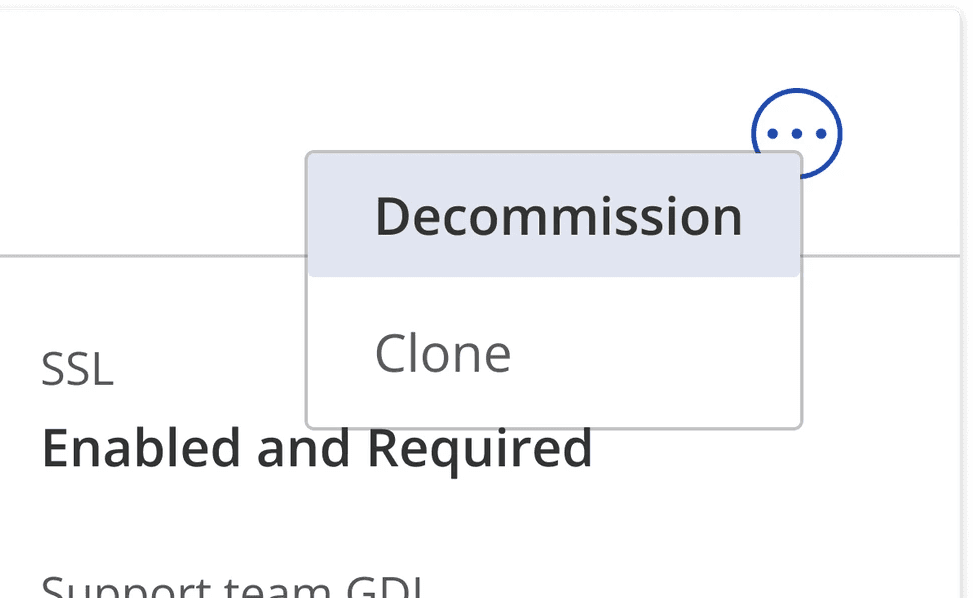
Decommissioning and Cloning
Added more interaction friction to decrease likelihood of erronous clicks.


Post-launch Design wins
The database portal was integrated and shipped within Cloudview. Instrumentation was setup to measure key indicators of success.
100%
Task completion success rate
Anyone who wanted a database asset could successfully request for one without external help.
2 mins
Average time on task
Engineers went from spending hours to put in request to under 2 mins.
0
Usability support tickets
No usability issues reported (measured weekly)